Help Me Analyze Travis Build Data
Hey, I study Media and Computer Science in Berlin and I need your help. The last goal of my studies is to write my bachelor thesis and I want to show you what it is about.
I am in colaboration with Travis CI (you may have heard about it) and my goal is to analyse the data Travis produces everyday. Data about every build that is triggered by any open source project over the world doing continuous integration.
Travis provides the possibility to implement webhooks. Webhooks are part of the travis notifications and are simple HTTP post requests to a given end point you define in your .travis.yml file (the general travis configuration file) triggered whenever a build at travis-ci end (no matter if successful or not). These requests include general data of the last build.
I already built up a web app to play around with the data. Right now there are three charts included. One is showing the success/fail ratio of all builds in a particular time interval. Another one shows the distribution of different projects included in a given time.
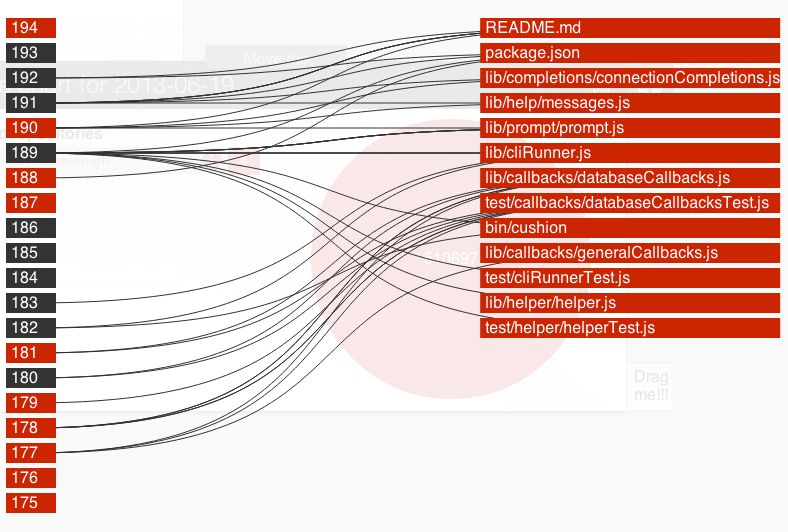
And the last one at the moment is one chart including data fetched from github.

I’m really excited about this one. What you see in there are the last 20 builds (left side) of one of my private projects. The nice thing about that is, that all the commits (right side) related to a given build are fetched from the github api. That means you can quickly figure out, which files are often causing a failed build (marked black and not red – like build with number 180).
With the information provided by github I could build up a tool to answer a lot of questions.
- which files are touched more often and cause broken builds?
- how many commits are needed to fix a broken build?
- how long does it generally take to fix a broken build?
- how many commits included in one build cause a broken build?
- how many different contributors cause a broken build?
I don’t know If it is possible and/or valid to answer these questions with given data, but I would like to try to answer a few of them. And the point is:
If only one person really hears something new about his/her project it would be already a win.
And hear is where you come into the game. When you use Travis CI please share your build data with me by implementing the webhook pointing to my webapp in your .travis.yml (just put it at the bottom of the file).
1 2 | |
Your data will be written into my database and will then be included into the charts.
And after that please share your ideas about what you would like to see and what would be useful for you and your project with me. Drop me a line on Twitter or send me an email. That would be just great.
The app is at a quite early stage right now, so if something is not working as expected or you see improvements get in touch as well.