Journey of Discovery - the Global 'window.performance' Object
A few days ago I was attending the Developer Conference Hamburg. Topics of the talks were nearly everything you could think of ( from Java to PHP to JavaScript and much more ). For me only frontend related talks were important and that was why I attended the talk of Alois Reitbauer with the title “W3C Web Performance – A detailed overview” ( slides of his talk can be found here ).
And well, what should I say? He introduced the window.performance object to the audience and that absolutely blew my mind, because there is really a lot of useful stuff in there and I did not know, that there was such an object available in the global window scope.
The performance object includes three additional objects, which provide information for different use cases:
- timing // instanceof PerformanceTiming –> true
- navigation // instanceof PerformanceNavigation –> true
- memory // instanceof MemoryInfo –> true
I tend to check out the particular specification for something I discovered, so let us have a first look inside of the spec for the Navigation Timing API, which is the base for the window.performance.timing and window.performance.navigation object.
It turned out, that the spec for Navigation Timing is work in progress. So please be careful, when dealing with stuff described in it. It may change in the future without a warning.
According to caniuse.com the Navigation Timing API is unfortunately not completely supported ( Safari is missing ), but it is definitely something to play around with. ;)
So let us check it out…
Specification for window.performance.timing – “interface PerformanceTiming”
–> getting general performance information of current document
Quote from the Navigation Timing specification:
To address the need for complete information on user experience, this document introduces the PerformanceTiming interfaces. This interface allows JavaScript mechanisms to provide complete client-side latency measurements within applications. […] This specification introduces an interface that provides Web applications with timing-related information.
For me that sounds really awesome. Accessing timing information of the current document via JavaScript can be become really useful for any optimization of your site. Especially when you are dealing with the goal of presenting your site / your web application to your customers in less than 1000ms every metric you can get, can help you succeed and compare current and improved versions.
Got curious? Let us check it out! :)

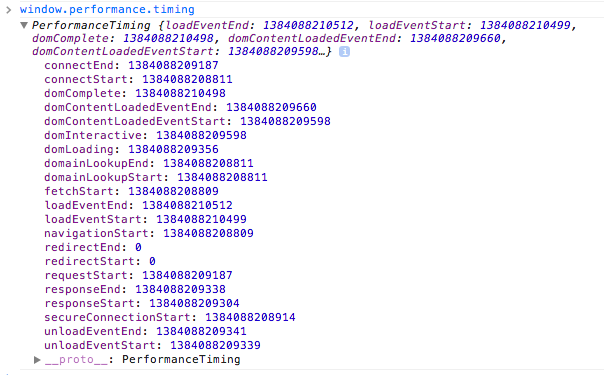
As you can see window.performance.timing includes a bunch of data that is predefined by the interface PerformanceTiming. The W3C provides inside of the spec itself a nice graphic to figure out, what these values stand for.

Example usage of data included in window.performance.timing
Let us start simple and try to figure out how long a document needs to load.
1 2 3 4 5 | |
No magic in there. You may say now “Well I can get this information inside of the DevTools” and well… that is true. But the nice thing of that is, that you are able to access this information easily and you could ( or rather should? ) log it to get a better idea of the actual performance and user experience of your visitors in their browsers.
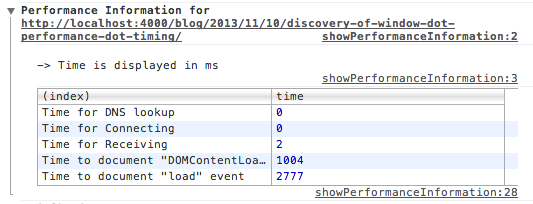
To show a bit more interesting information than loadingTime and to make the usage of this a bit clearer I created a little snippet ( can be found here ), which you can save inside of your Chrome DevTools. With the usage of that we can easily display the main document metrics, when dealing with performance, without even touching the Network panel inside of the DevTools.

Specification for window.performance.navigation – “interface PerformanceNavigation”
–> getting information of navigation context
According to the specification the object window.performance.navigation only has to include two values, which give you information about the “last non-redirect navigation in the current browsing context”. Maybe you are thinking “I do not get it” like I did one hour ago, but it is not really complicated as well.
Let us have a look at an example:
1 2 3 4 5 6 7 8 9 10 | |
To sum up the possibilities of the type attribute, it can have the following values:
- 0 – site was directly entered
- 1 – site was reloaded
- 2 – site was entered via history
- 255 – none of the first three options matches
Additionally the object includes redirectCount, which will give you unfortunatelly only “nearly” the information you would expect. It will only count redirects from the same origin. That means if you want to check if there was a redirect via a URL shortener for example, redirectCount will still return 0. I can not say, what is the exact reason for that decision, but it is defined in the spec this way. For redirects on your site it just works fine. ;)
window.performance.memory – unfortunately no spec found
–> getting general information of JavsScript memory usage
Unfortunately I was not able to find any specification for this included object ( maybe you can ping me and point me into the correct direction – I really would like to read it ). Googling for ‘interface MemoryInfo’ or ‘jsHeapSizeLimit spec’ unfortunately did not give me any useful information.
But anyway… I have not played around with memory profiling of JavaScript yet, but information about the current document can be found there – only wanted to mention it because it is included. ;)
Example of the window.performance.memory object:
1 2 3 4 5 6 7 | |
Specification for window.performance – “interface Performance”
–> getting detailed information of in document included ressources
By using the in window.performance included objects ( timing, navigation, memory ) it is easily possible to receive information of the current document. That can be really helpful to figure out if the particular document has any performance problems. If you want to dive into that in more detail, you probably need a bit more information:
- why needs the document so much time to finish loading?
- which ressource takes the most of the loading time?
- can I avoid loading problematic ressource at initial load?
The spec for the Performance Timeline describes the interface Performance to have the following functions, which help to figure out exactly, where performance problems can have their origin:
- getEntries()
- getEntriesByType( DOMString entryType )
- getEntriesByName( DOMString name, optional DOMString entryType )
So let us check it out.
getEntries is defined to return a PerformanceEntryList. A PerformanceEntry has to have the following values:
- name
- entryType
- startTime
- duration
That looks pretty handy for me. I created another JavaScript snippet ( can be found here ) to make usage of that. The script fetches all entries by calling getEntries and sorts all the entries by the amount of duration beginning by the entry with the highest duration. The output for example for google.com looks like that:

Especially this data can be extremely useful, when dealing with performance bottlenecks. Additionally there is to say, that all the entries have much more included information than the particular interface describes. It is definitely worth a look, if you want to dive deeper into this topic.
Data included in one PerformanceEntry:
1 2 3 4 5 6 7 8 9 10 11 12 13 14 15 16 17 18 19 20 21 22 23 | |
I did not check the other to functions, because getEntries totally fits my needs right now, but if you have any good use cases for them, I would really like to know them.
Sum up – window.performance FTW
window.performance includes a lot of useful information for creating a good user experience by focussing on performance ( remember “Performance is a feature?” ). Especially the information about the document in general and particular ressources can become really handy. For me it is clear, that I will use it a lot in the future to get a nice overview of what is really going on the sites I am responsible for.
I hope you will start playing around with it as well and that is it for today. Thx for reading and I hope you enjoyed it. ;)