How to Measure Frontend Performance With Grunt
When you are a frontend developer, you are on the constant journey to find the right tool to measure the performance of your site. Sure, there are the Developer Tools of your choice, Google Pagespeed or webpagespeed.org available. And those tools are great (if you do not know them, you should definitely check them out), but for me it was always “just” nice to use these tools. They provide lots of useful information and I check them on a regular basis, but as far as I know, these tools do not provide a kind of timeline view of my daily work. They only give useful information to a given time – that is it. What I want to know, is how the site evolved after my latest deploy to production …
Did the size of CSS / JavaScript decrease or increase? How many Ajax requests are made on page load? How many DOM queries are executed? And how did my latest changes effect the overall performance of the site?
Sure, I could answer all these questions manually and could keep track of them in some way, but that is not in the nature of a developer, right? ;)
That is definitely a task that belongs to an automated process and should be done right after the deployment to production, so that I can check right away, what happened and how the production site changed.
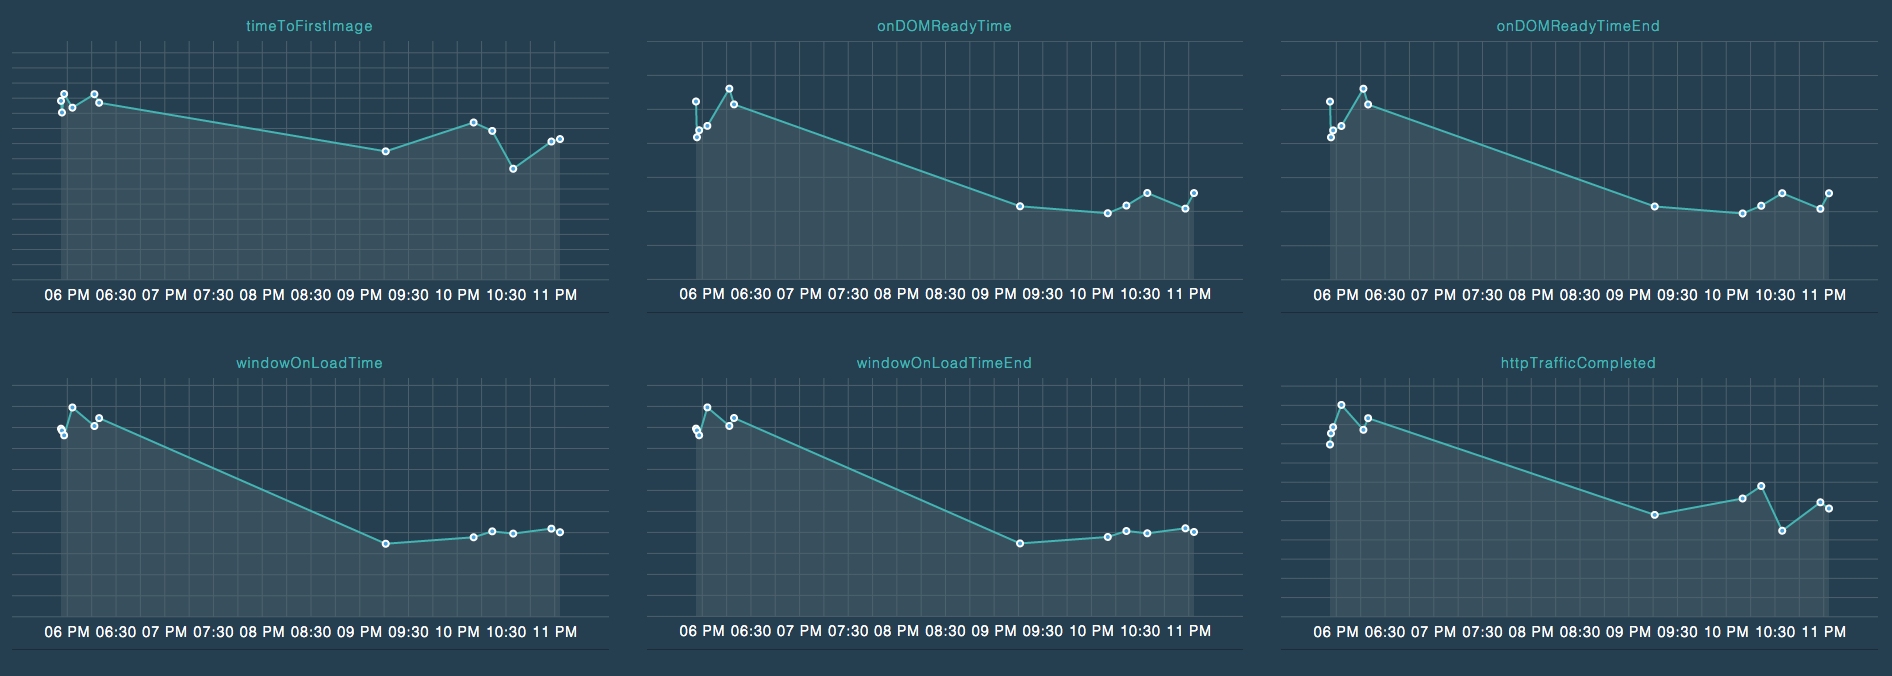
Well, ( attention shameless self promotion ) – I wrote a Grunt plugin called grunt-phantomas to solve exactly that problem (preview of generated example results here).
Two weeks ago I discovered a NPM module called Phantomas and it absolutely blew my mind. It is a command line tool, which scans any site you like via PhantomJS. You can easily install it via npm install -g phantomas and after that, you are ready to go. To show how powerful this tool is, let us have a look at the by Phantomas given statistics of the Grunt site as an example.
1 2 3 4 5 6 7 8 9 10 11 12 13 14 15 16 17 18 19 20 21 22 23 24 25 26 27 28 29 30 31 32 33 34 35 36 37 38 39 40 41 42 43 44 45 46 47 48 49 50 51 52 53 54 55 56 57 58 59 60 61 62 63 64 65 66 67 68 69 70 71 72 73 74 75 76 77 78 79 80 81 82 83 84 85 86 87 88 89 90 91 92 93 94 95 96 97 98 99 100 101 102 103 104 105 106 107 108 109 110 111 112 113 114 115 116 117 118 119 120 121 | |
When I saw these metrics for the first time I really had to dance for joy. They are by far the most powerful metrics I have seen. I thought about these metrics a bit more and descided that Phantomas is perfect for an automated process to keep track of all that after every deployment. Grunt is included in most of the projects I do, so it was not a big question how to create an automated task. That was the moment when grunt-phantomas was born and that is what it looks like today:

All you have to do is to integrate the plugin in your Grunt process and then you are ready to go. You just have to define a folder, where the generated index.html and needed files will take place, as well as the wished url to get metrics for. And then run it with grunt phantomas. Any more needed information can be found in the official documentation.
Additional possible options are by now the following:
- number of runs –> Phantomas will be executed multiple times to make the data more reliable
- raw phantomas arguments –> Phantomas has lots of options – it is for example possible to block external scripts, what can become extremely handy when you have to deal with lots of marketing stuff (check Phantomas Docs for more a complete list of options)
We integrated it into our CI system in my company already, so that I can really check all that data right after deployment and I’m really excited about that. In my opinion this can be an extremely valuable tool and any feedback on it is more than welcome.
And that is it. Thanks for reading and merry Christmas. :)